Modern strace.
Real-time TUI.
Kubernetes‑ready.
Aggregate syscalls live — counts, latencies, errors, anomalies — in an interactive htop-style dashboard or HTTP sidecar for your Pods.
go install github.com/fabianoflorentino/stracectl@latest
Privacy-first by default
safe, auditable tracing
Minimise accidental exposure: automatic redaction, TTL-backed ephemeral logs, and an auditable provenance trail make traces safe to collect and share.
Safe defaults
Runs in a conservative privacy mode by default: syscall argument payloads are redacted unless explicitly requested with --full.
Flags: --no-args, --max-arg-size, --redact-patterns, --privacy-level
Ephemeral logs & audit
Write redacted events to a privacy log with --privacy-log. Use --privacy-ttl to auto-expire files and rely on the generated .audit file for provenance and integrity (SHA256).
stracectl run --privacy-log trace.json --privacy-ttl 24h --no-args <cmd>Deterministic redaction
Built-in pattern set (JWT, emails, tokens, IPs) with configurable additions via --redact-patterns. Redaction is applied before any formatting or output.
Explain & audit
Use stracectl explain to preview what will be captured. When writing a file, the accompanying audit log records actor, options, event counts and a file hash for secure sharing.
Everything you need to
understand your syscalls
Built for developers and SREs who need signal, not noise.
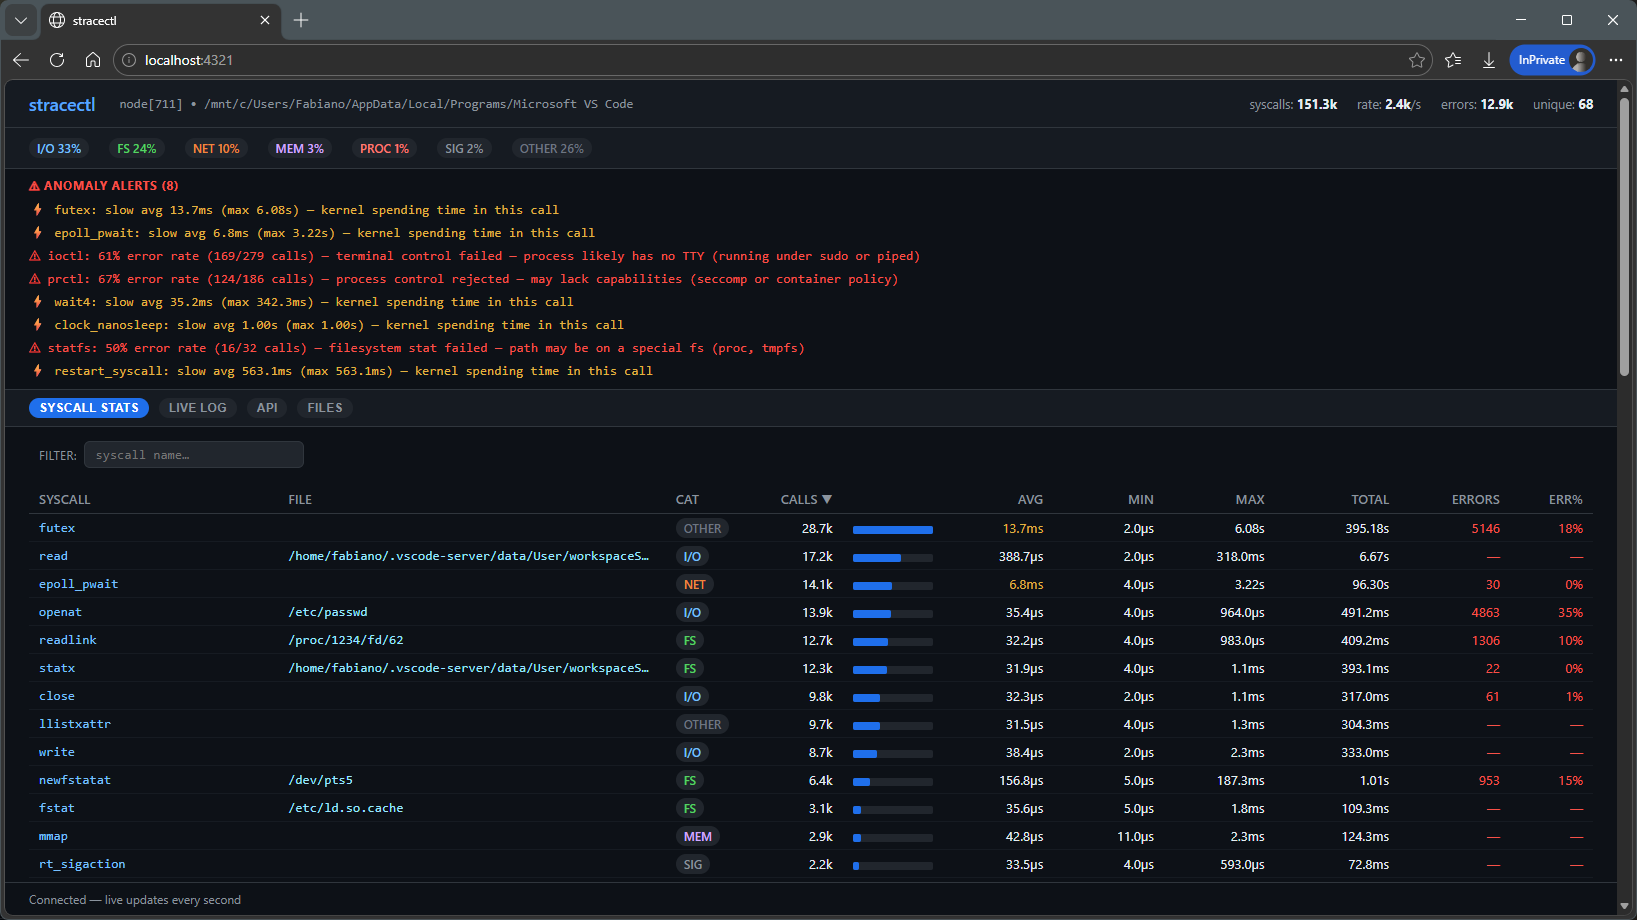
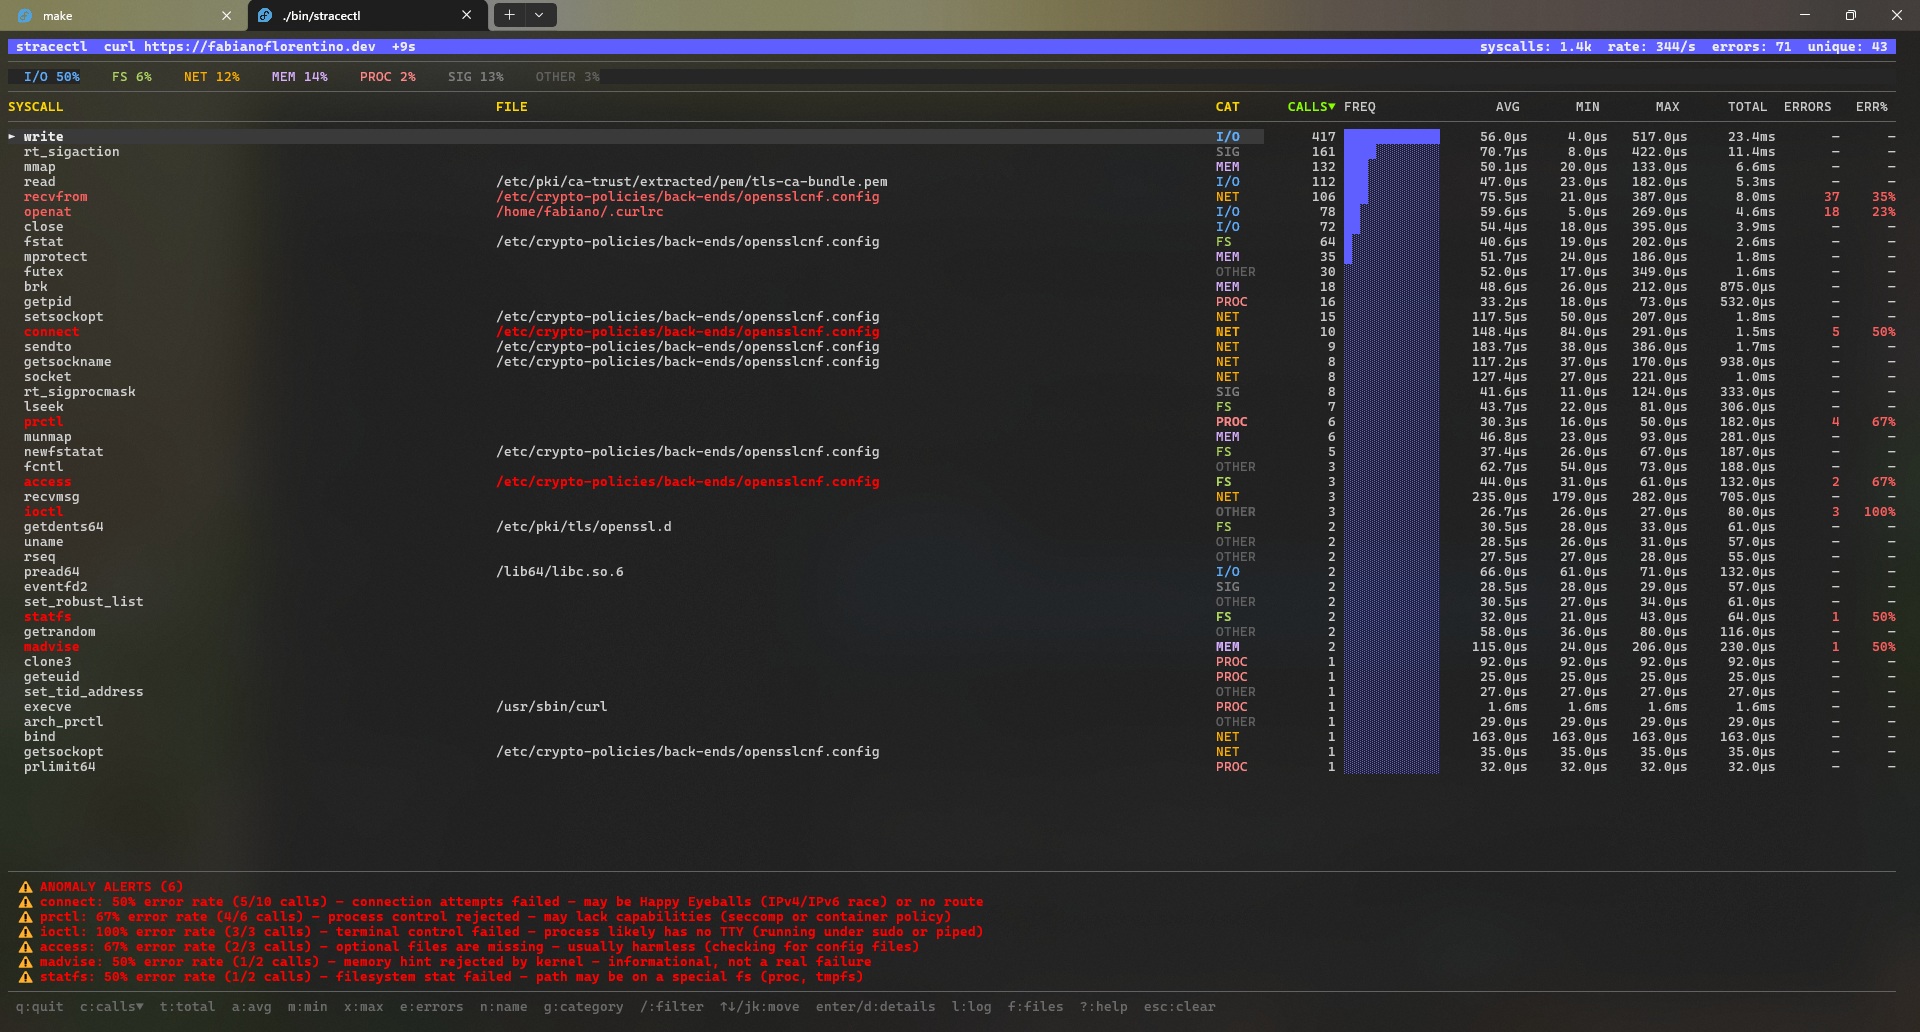
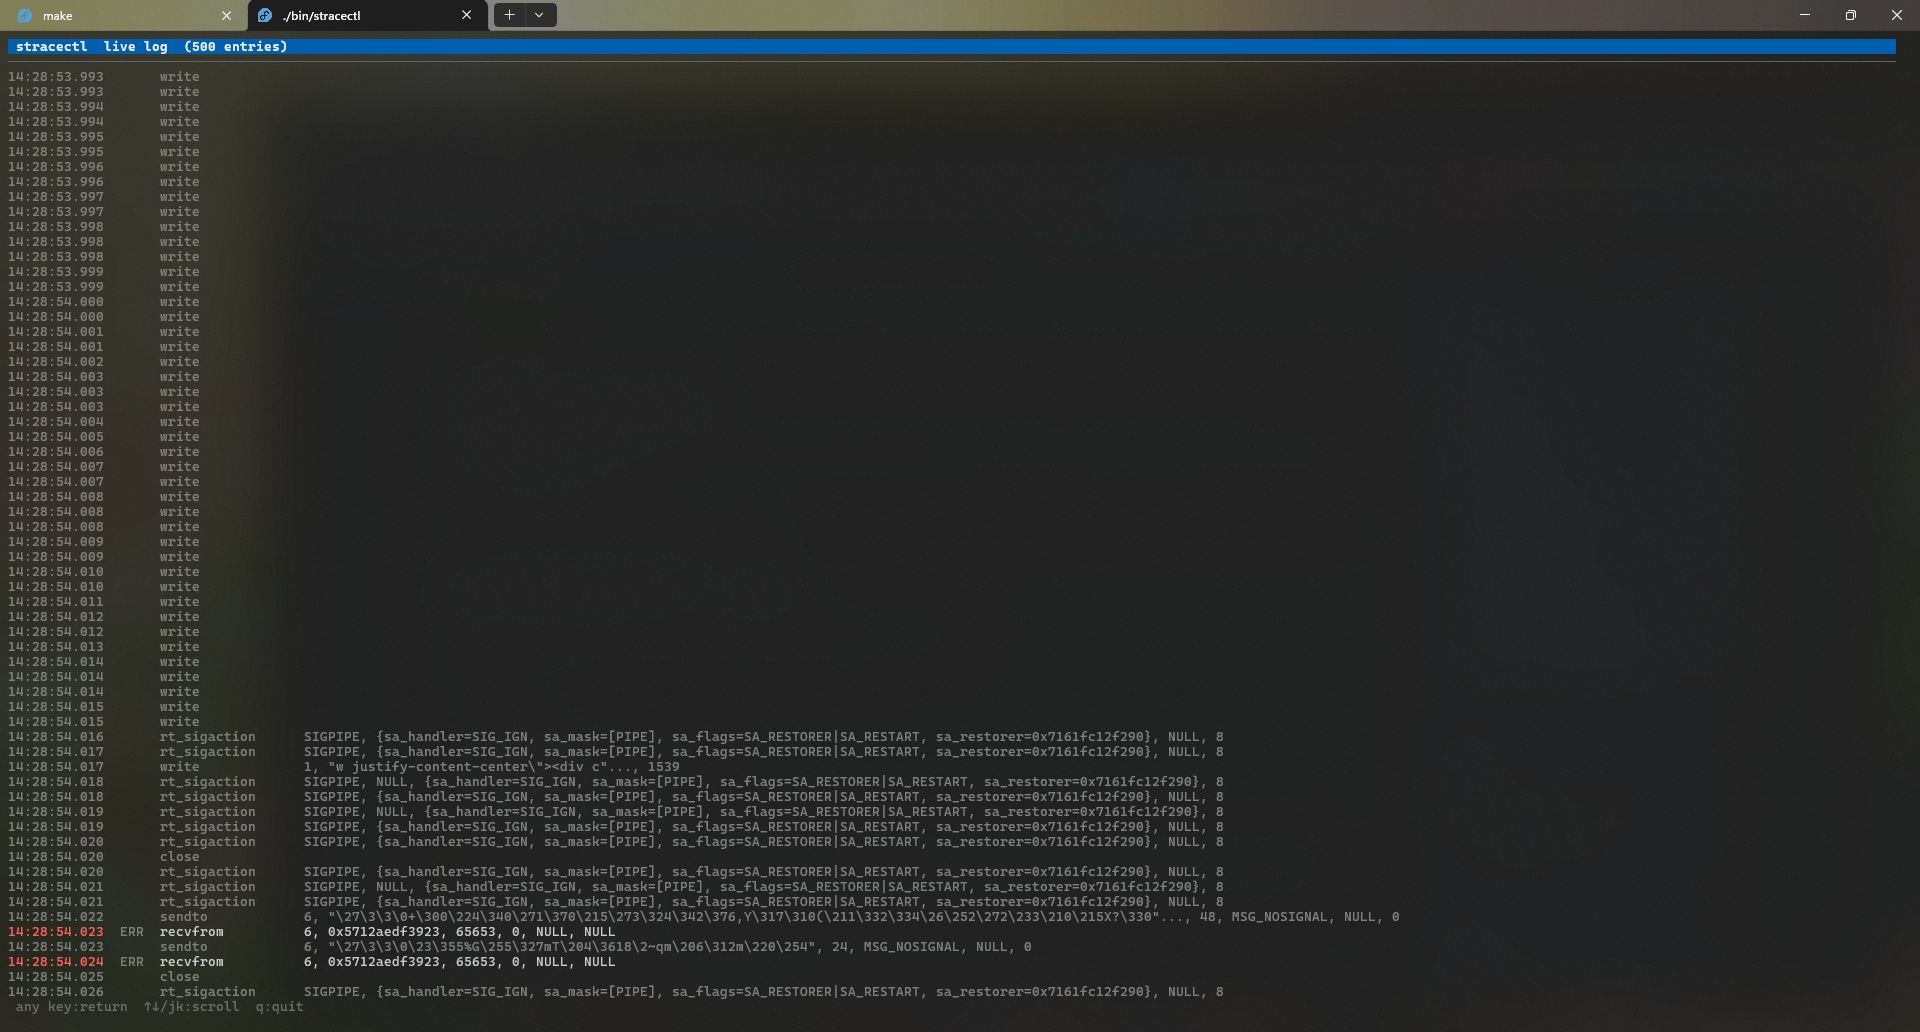
Real-time Aggregation
Syscalls counted, timed, and grouped as they happen. No log file, no post-processing — just live signal.
Latency Columns
AVG, MAX, TOTAL, P95, and P99 per syscall. MAX exposes outliers that averages always hide.
Smart Anomaly Detection
Rows turn red when ERR% ≥ 50 %, yellow when AVG ≥ 5 ms. Human-readable explanations at the bottom.
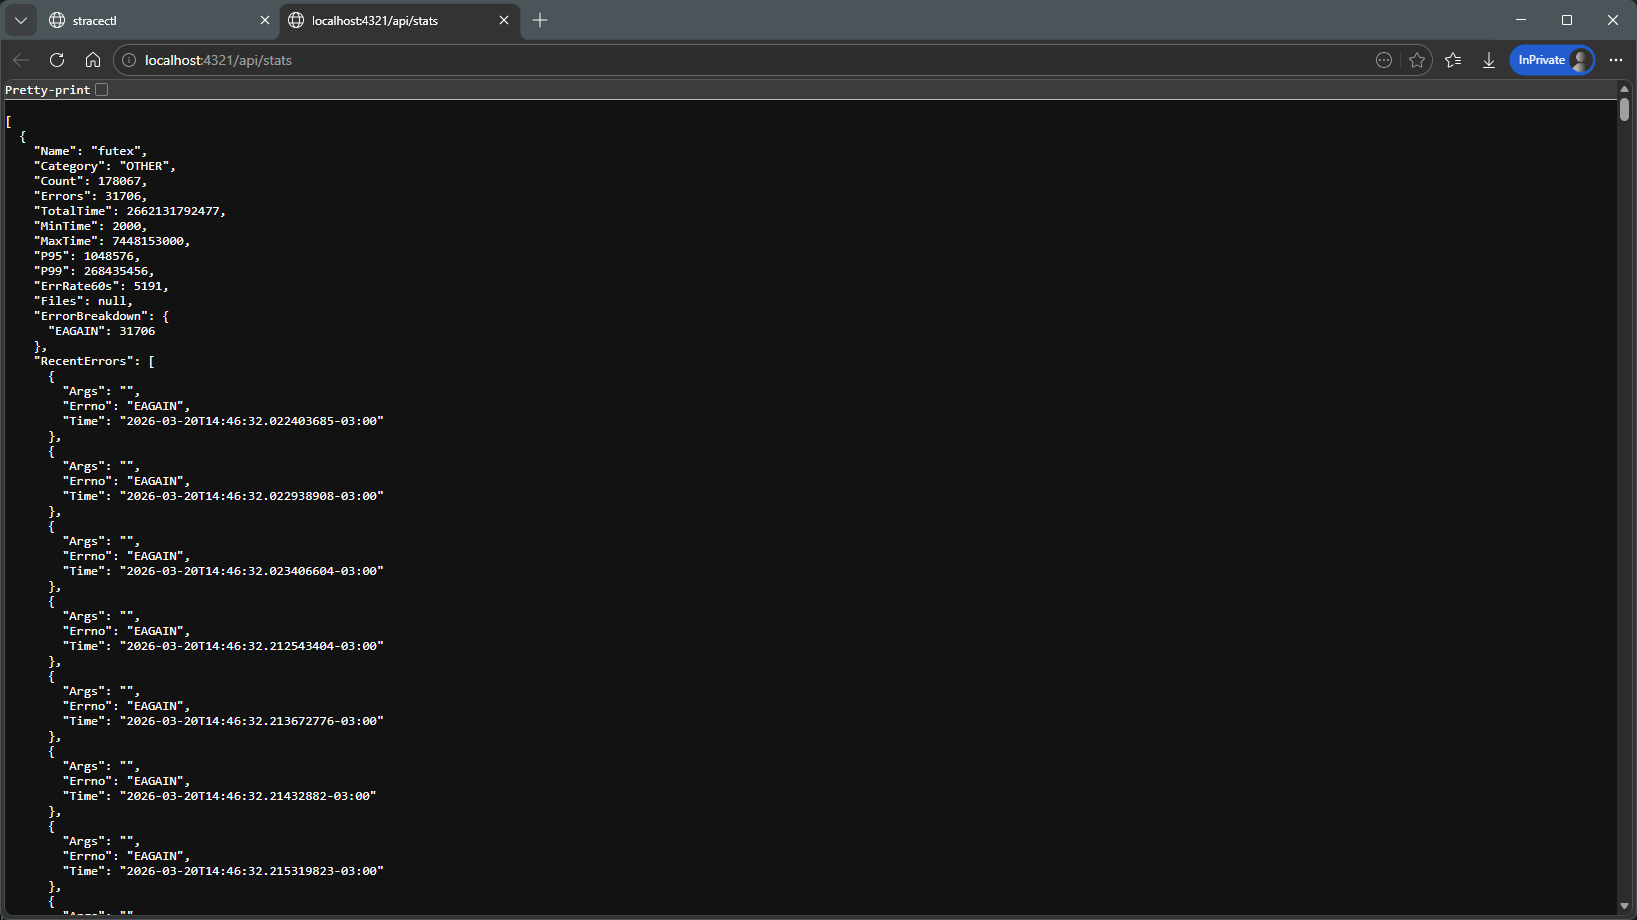
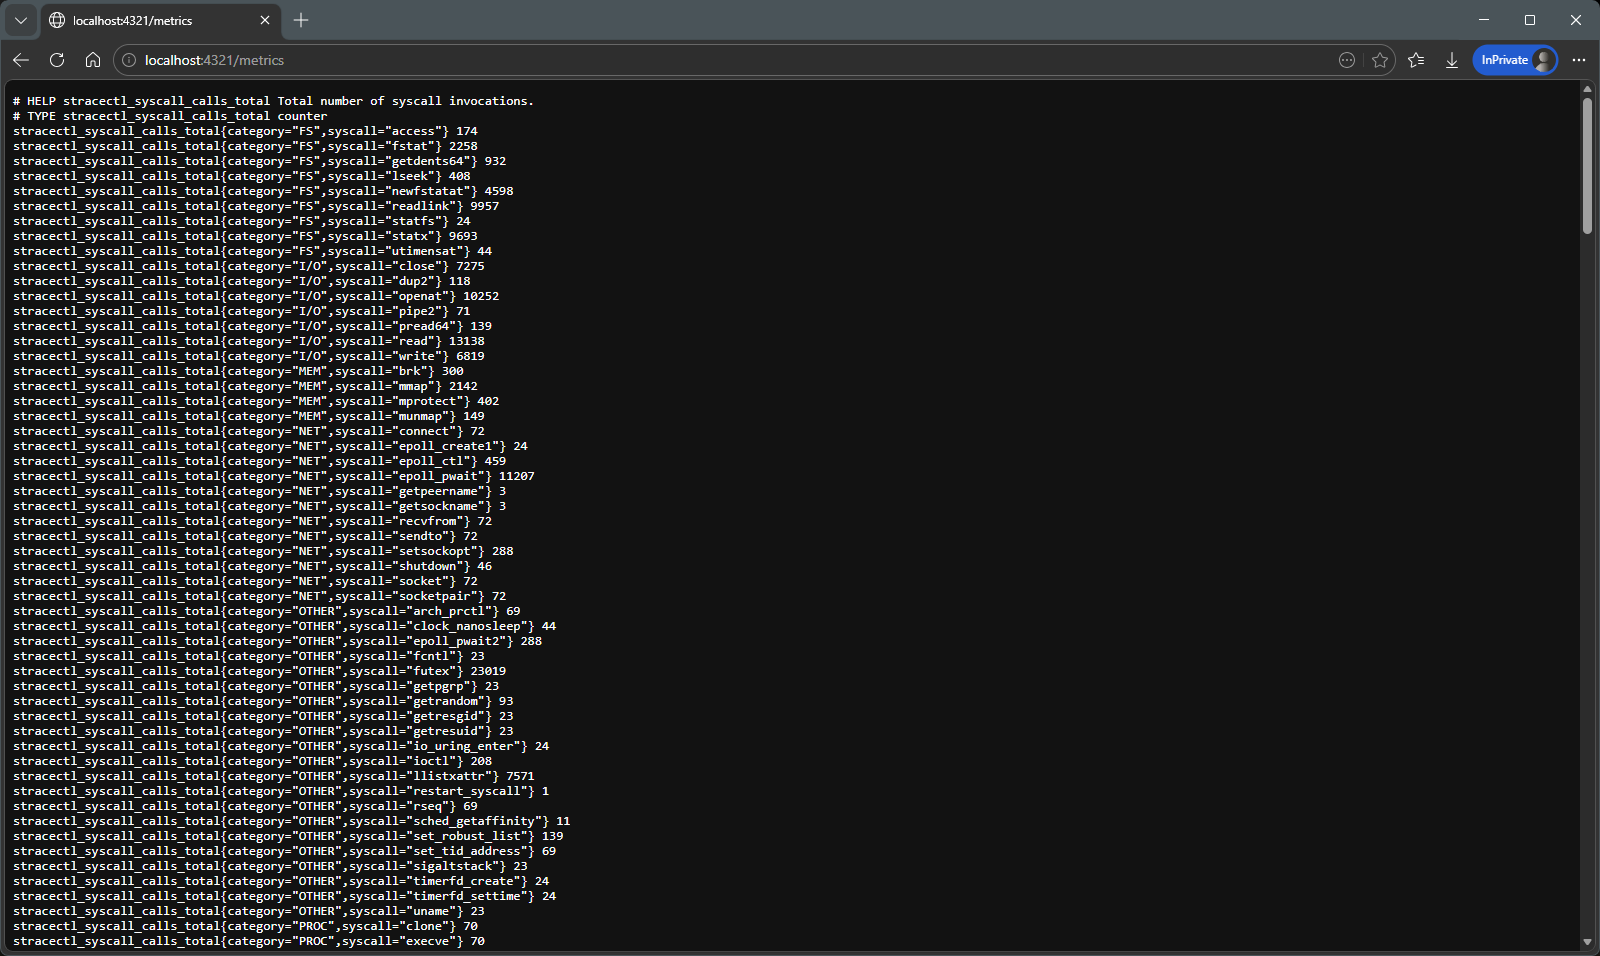
HTTP Sidecar Mode
--serve :8080 exposes JSON, WebSocket, and Prometheus endpoints. Live HTML dashboard included.
Kubernetes-Ready
Dockerfile, raw manifests, and a Helm chart with hardened sidecar security context. Discover PIDs across namespace boundaries.
HTML Report Export
--report report.html writes a self-contained, sortable HTML file — no server, no CDN, no stracectl needed to view it.
Privacy-First Tracing
Safe-by-default tracing with automatic redaction, TTLs, and audit provenance to minimise exposure of tokens, PII, and secrets during investigations.
Per-errno Breakdown
See exactly how many failures map to ENOENT, EACCES, EAGAIN — not just the aggregate error count.
Post-mortem Analysis
stracectl stats trace.log replays any strace -T -o log through the same TUI and HTTP API — no live process needed.
Interactive Filter
Press / in the TUI to narrow down syscalls in real time. The web dashboard has a search bar above the table.
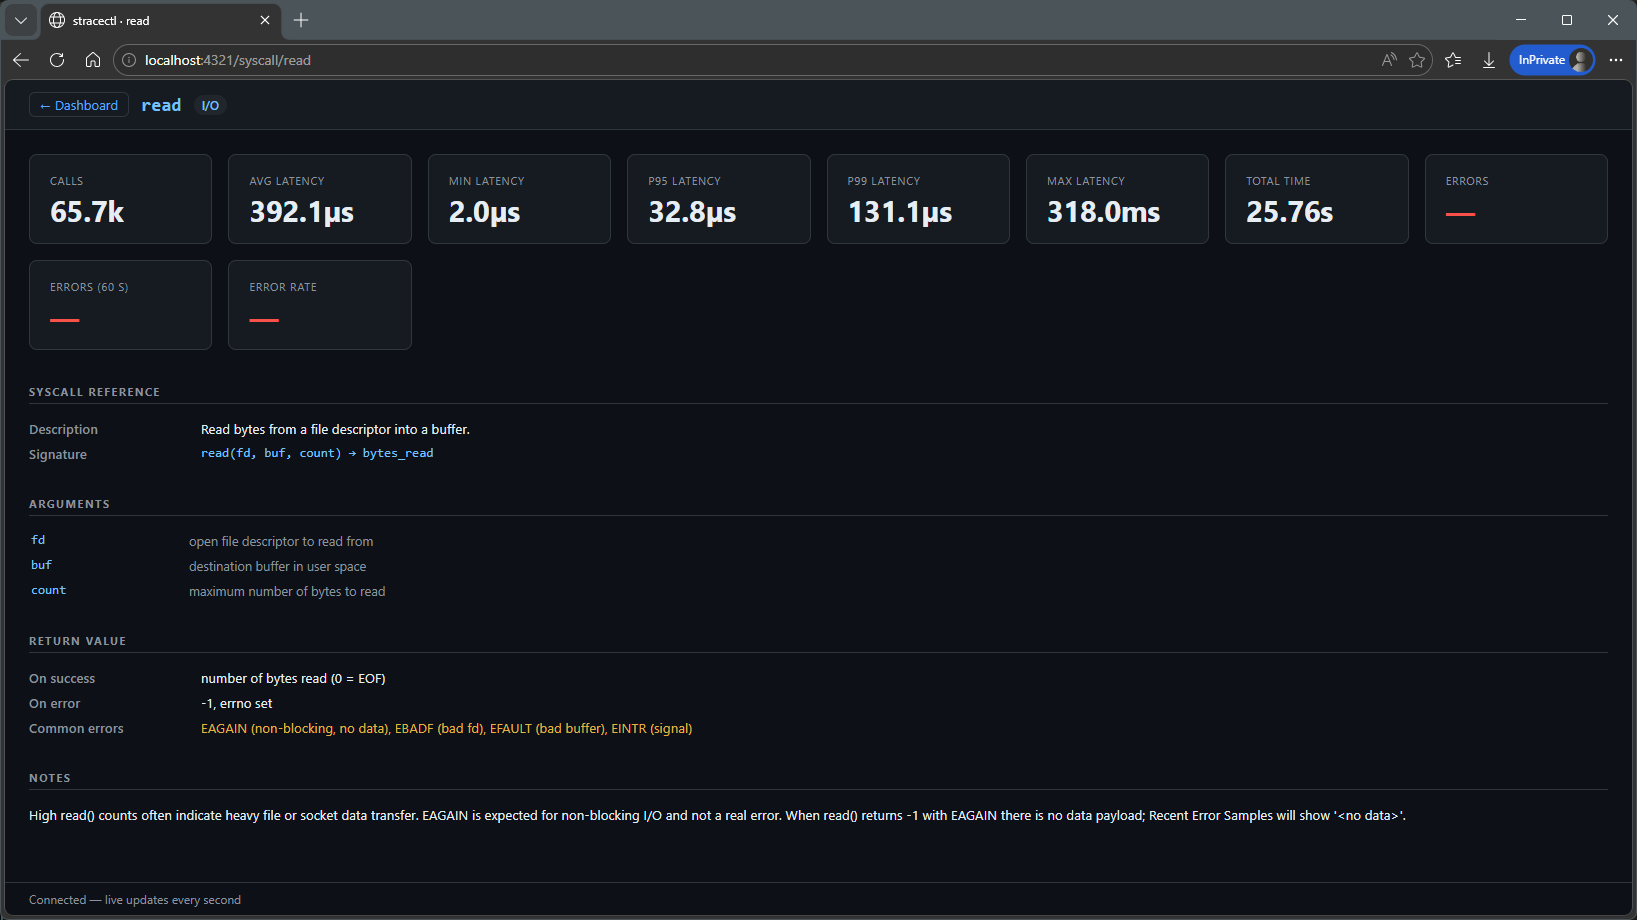
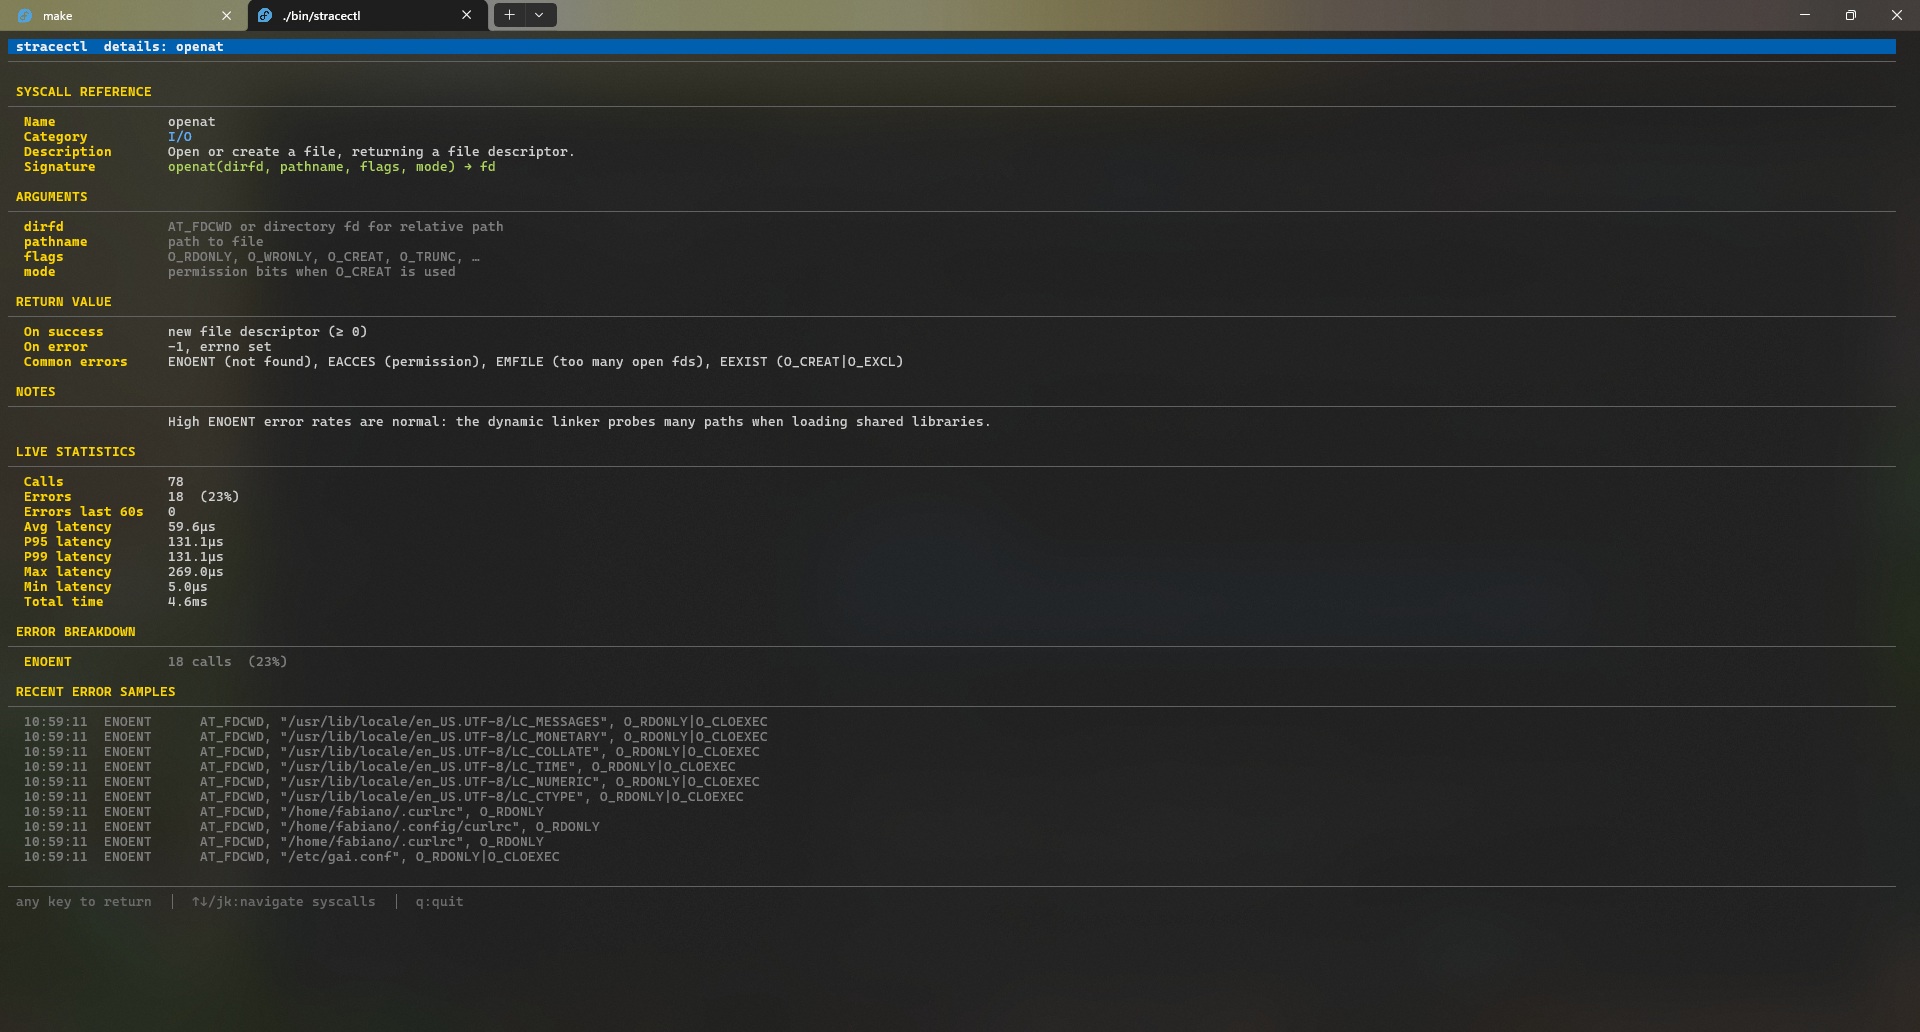
Built-in Syscall Reference
Every tracked syscall ships with its C signature, argument descriptions, common errno codes, and diagnostic notes — inline in the TUI and web detail page, no browser tab needed.
Dual Backends — eBPF & strace
Choose low-overhead kernel tracing with eBPF, or fall back to the classic strace subprocess. Auto-selection available via --backend auto.
See it in action
From interactive TUI to live web dashboard to self-contained HTML report.
Three modes
one tool
TUI Mode
Run or attach to any process. The htop-style dashboard updates live every 500 ms — sort, filter, explore details without leaving the terminal.
sudo stracectl run nginxsudo stracectl attach 1234Sidecar / HTTP API Mode
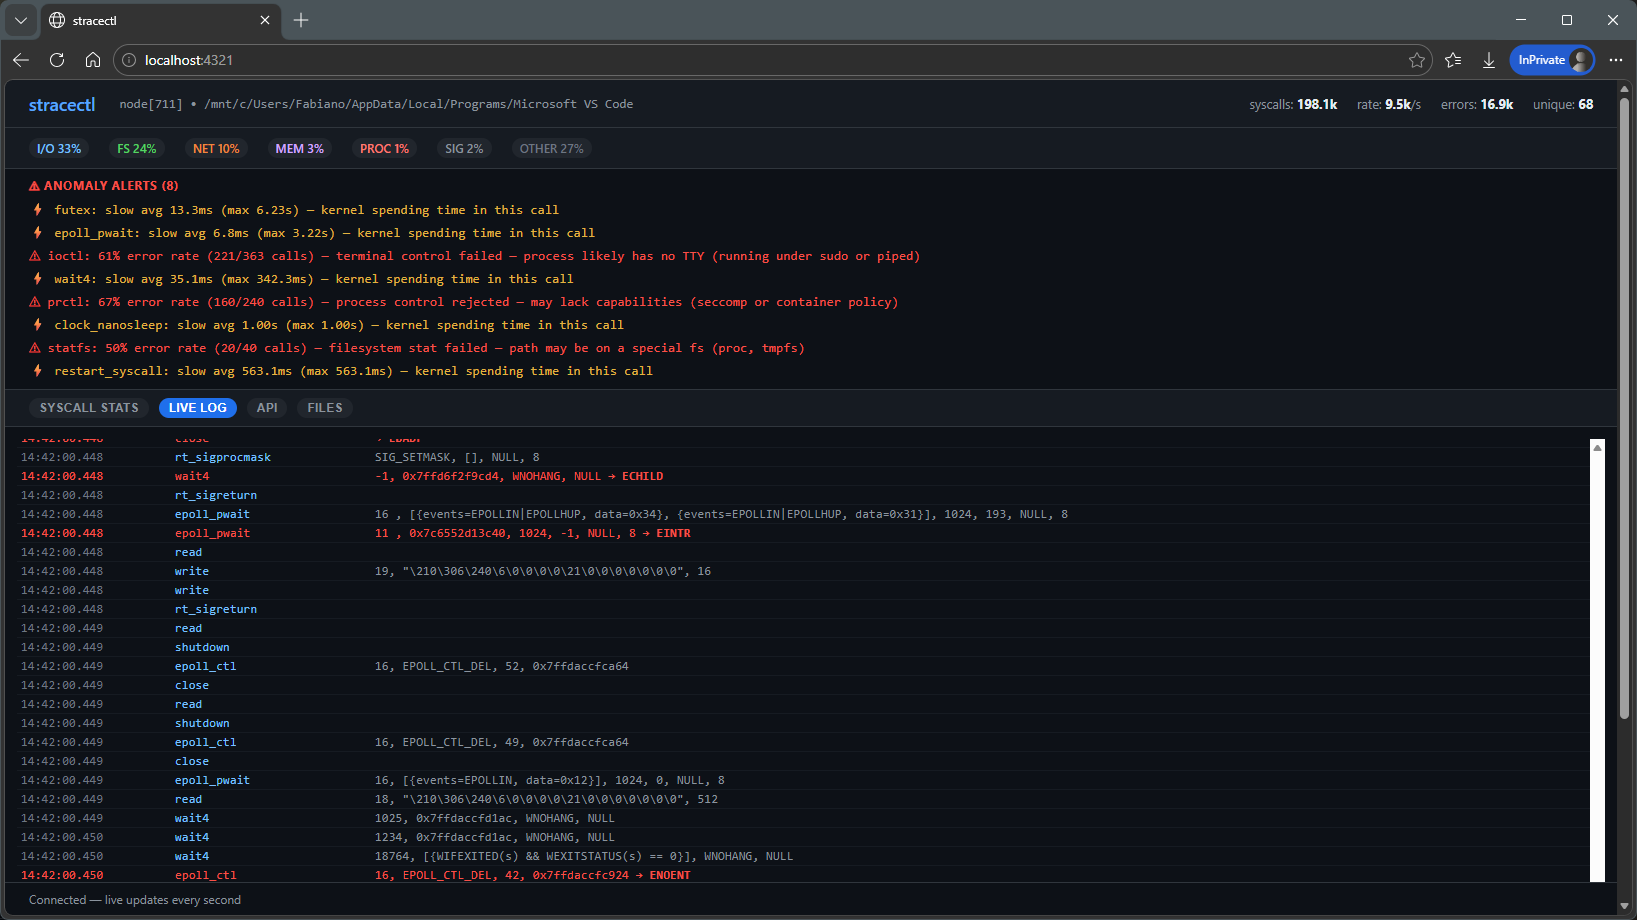
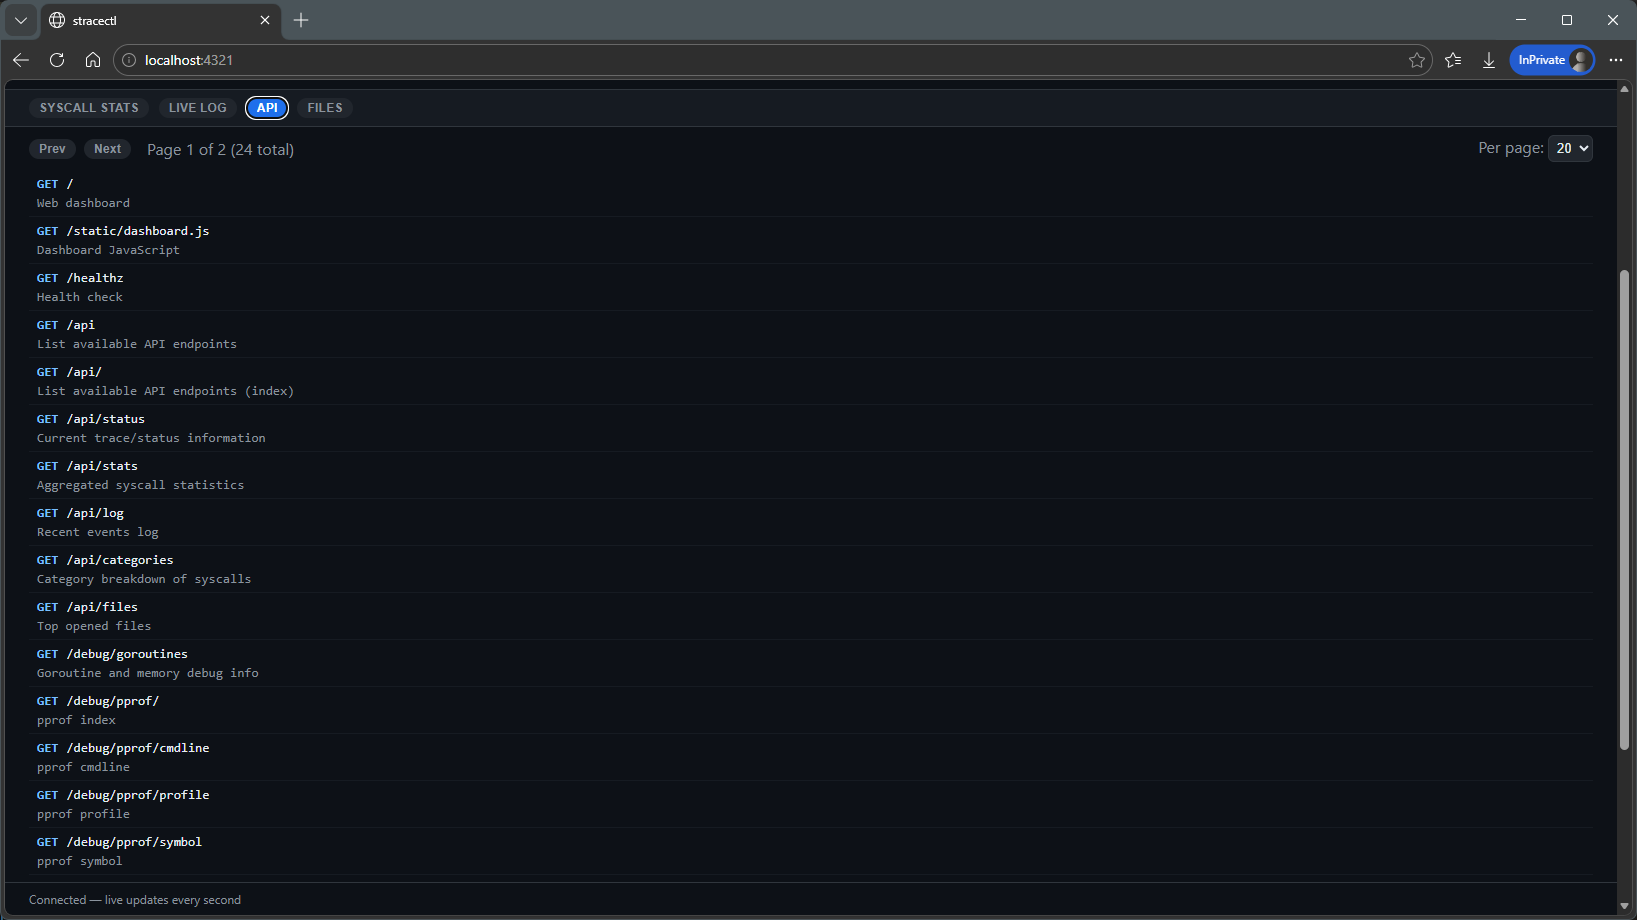
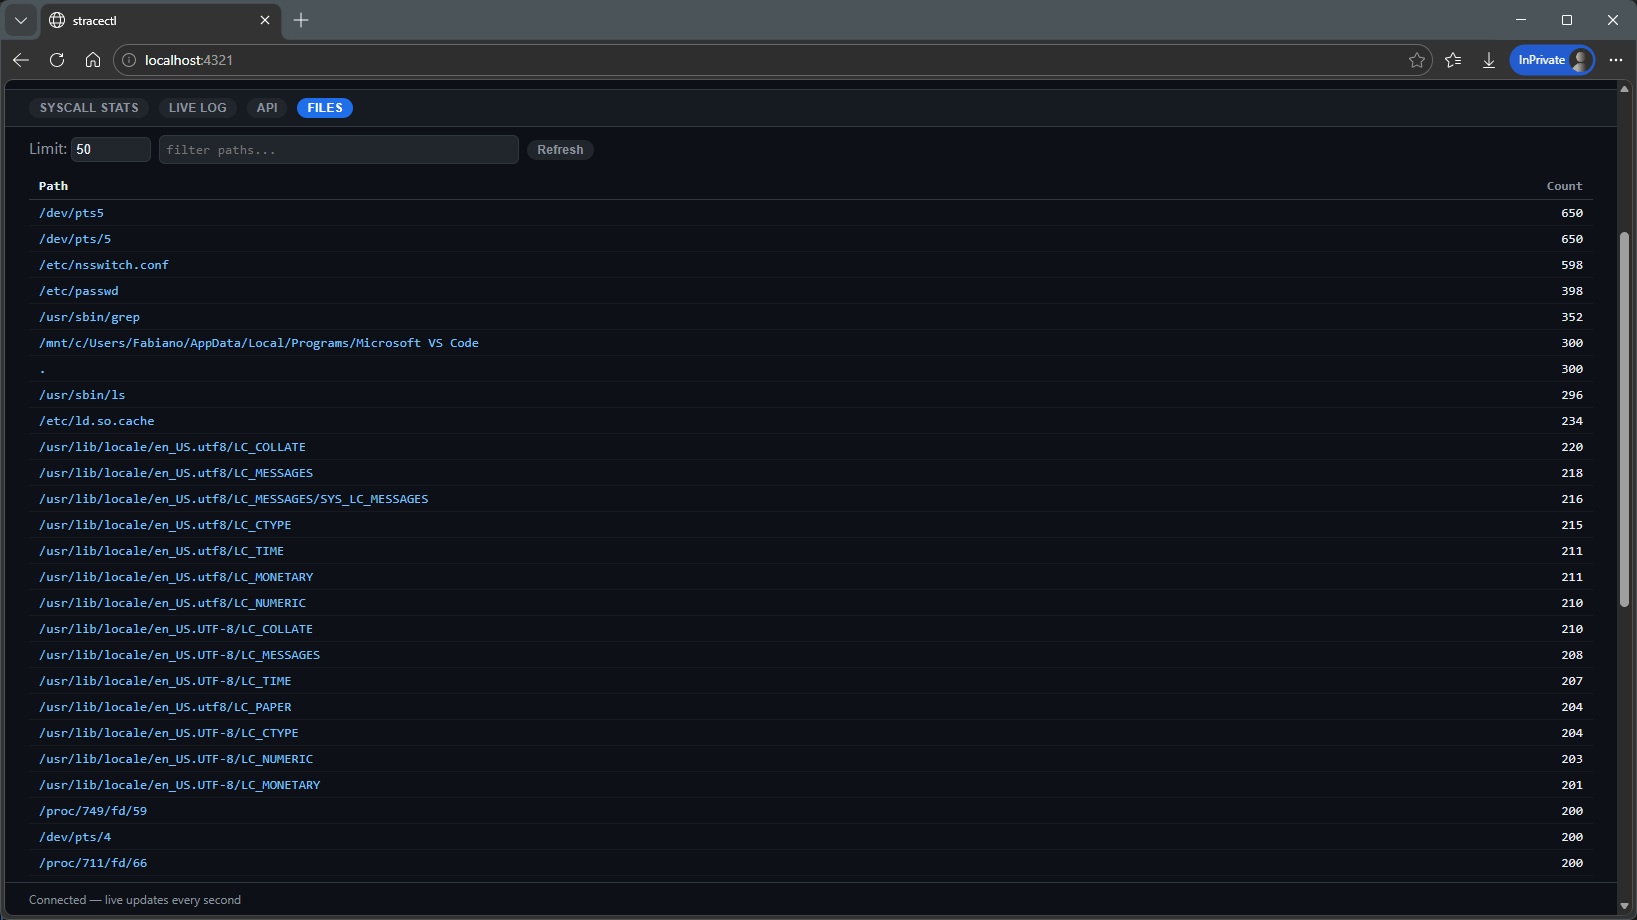
Add --serve :8080 to replace the TUI with an HTTP server — JSON at /api/stats, WebSocket live feed, Prometheus metrics, and a React-free live dashboard at /.
sudo stracectl attach --serve :8080 1234Post-mortem / Stats Mode
Already have a strace -T -o log? Feed it to stracectl stats for the same TUI, HTTP API, or HTML report — no live process needed.
stracectl stats --report out.html trace.logReal examples
usage scenarios
Step-by-step walkthroughs showing how to use each mode to troubleshoot real problems.
Interactive TUI
Run a command locally, inspect latency and errors live, and export a self-contained HTML report for sharing.
sudo stracectl run --report report.html curl https://example.comSidecar / HTTP API
Attach a sidecar in Kubernetes, port-forward the dashboard and inspect syscalls without disrupting the workload.
kubectl -n <ns> port-forward pod/<sidecar-pod> 8080:8080Post-mortem & eBPF
Analyse saved traces or switch to the eBPF backend for low-overhead tracing — examples and recommendations in the scenarios guide.
stracectl stats --report report.html trace.logTwo tracing backends
eBPF and strace
Pick the tracer that best fits your environment: low-overhead kernel events or the universal strace fallback.
eBPF backend
Kernel-level tracing with minimal overhead. Requires Linux ≥ 5.8 and an eBPF-enabled binary (built with -tags=ebpf). Ideal for production observability.
strace backend
Classic userspace tracer via the strace binary. Works on systems without eBPF support and requires no special kernel features.
--backend auto|ebpf|straceNot just counts
built-in explanations
Press Enter on any row to see the syscall's signature, arguments, errno codes, and diagnostic notes — inline, without leaving the terminal. The same reference is available on every web detail page.
openOpen or create a file, returning a file descriptor.
openat(dirfd, pathname, flags, mode) → fd💡 High ENOENT rates are normal — the dynamic linker probes many paths when loading shared libraries.
Initiate a connection on a socket to a target address.
connect(sockfd, addr, addrlen) → 0💡 ~50% error rate is expected with Happy Eyeballs (RFC 8305) — IPv4 and IPv6 race in parallel; the loser always fails.
Fast user-space locking — the kernel backing for mutexes and condition variables.
futex(uaddr, op, val, timeout, …) → 0💡 High syscall counts suggest lock contention — futex only enters the kernel when a thread must actually sleep.
~50 canonical syscalls documented — signatures, arguments, errno codes, and real-world diagnostic notes.
View full syscall reference →Up and running
in seconds
Linux only (uses ptrace via the strace binary). Requires Go 1.26+ or pull the pre-built container image.
go install github.com/fabianoflorentino/stracectl@latestgit clone https://github.com/fabianoflorentino/stracectl
cd stracectl
go build -o stracectl .
sudo mv stracectl /usr/local/bin/docker pull fabianoflorentino/stracectl:v1.0.124Ready to see inside
your processes?
Open source. MIT licensed. Built with Go and Bubble Tea.